Figure 5.
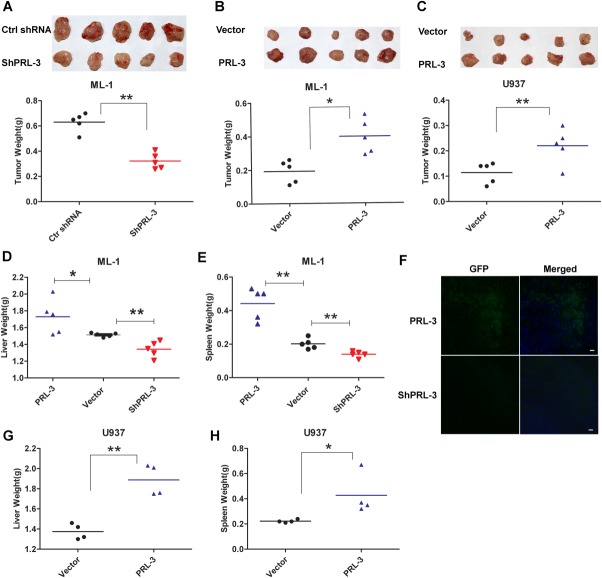
The function of PRL-3 in tumorigenesis and leukemogenesis. (A,B) Tumor formation induced by ML-1 cells stably transfected with scrambled ShRNAs (Ctrl shRNA) or with PRL-3–specific RNAs (ShPRL-3) on the 20th day post-subcutaneous injection (psi) (A), or with empty vector (Vector) or PRL-3 (PRL-3) on the 14th day psi (B) in nude mice. Upper panel shows the dissected paired tumors from each mouse; Lower panel shows the weight (g) of the indicated tumors. *P < .05; **P < .01; n = 5 (paired Student t test). (C) Tumor formation induced by U937 cells transfected [as in (B)] in nude mice on 14th day psi. **P < .01, n = 5 (paired Student t test). (D,E) Livers (D) and spleens (E) weight (g) of the nude mice injected with the indicated ML-1 cells through tail-vein transplantation. Mice were sacrificed on the 15th day post inoculation, and the organs were dissected and measured. *P < .05; **P < .01, n = 5 (unpaired Student t test). (F) IF staining of GFP on the frozen sections of the spleens as shown in (E) to discriminate the injected GFP-labeled AML cells from mice cells. Nuclei were stained with DAPI. Bar represents 25 μm. (G,H) Livers (G) and Spleens (H) weight (g) of the nude mice injected with U937 cells stably transfected with the indicated constructs as in (D) through (E). Mice were sacrificed and dissected on the 15th day post-inoculation as in (D) through (E). *P < .05;**P < .01, n = 4-5 (unpaired Student t test).

