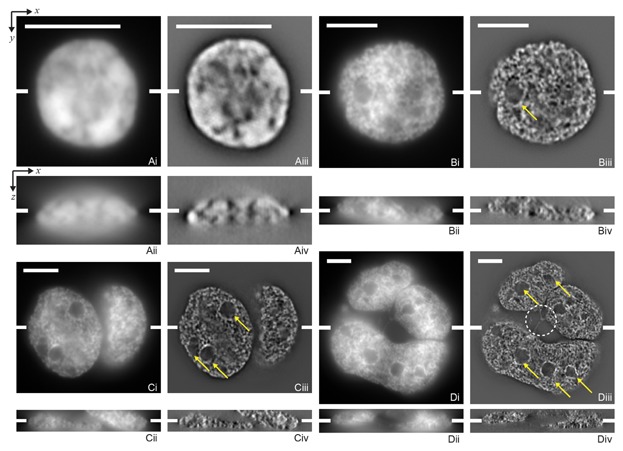
Figure 1.

Slices from DAPI stained cell nuclei of a control lymphocyte (A), a mononucleated Hodgkin cell (B), a binucleated Reed–Sternberg cell (C), and a multinucleated Reed–Sternberg cell (D). (See Fig. S1 for tri- and tetranucleated cells.) Widefield images are shown in images (i,ii) and unclipped SIM images in (iii,iv). The top row (i,iii) shows a lateral (x,y)-slice and the bottom row (ii,iv) an axial (x,z)-slice. The scale bars are 5 μm in each lateral slice—note the increasing image size from A to D—the tick marks in the middle of each panel indicate the positions of the corresponding orthogonal planes. The arrows denote “holes” in the DNA distribution of these cells. Note that not all apparent holes are indicated to maintain clarity. The multinucleated cell (D) contains a tri-directional anaphase bridge between several of the subnuclei (dashed circle in Diii). The intensities of all images are linearly stretched between their minimum and maximum value. Note that the DNA structure becomes visible by comparing the SIM images to the widefield images. Also note the difference in the structure between the different images.
