
Figure 2.
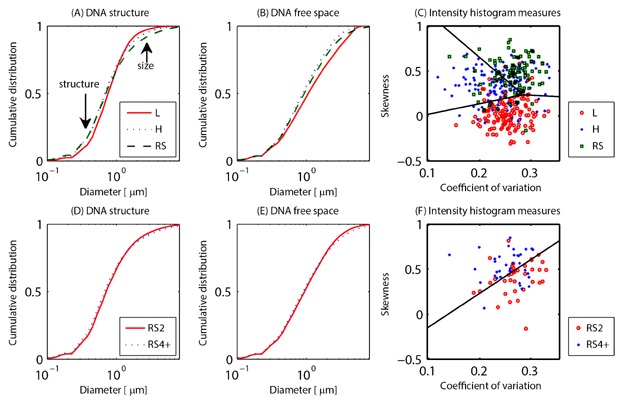
Measurements on SIM images of DAPI-stained nuclei of the size distribution of the DNA structure and DNA-free space, as well as the intensity histogram. These visible structures are depicted in Figure 1. The top row (A–C) shows these measures for lymphocytes (L, red solid lines and circles), Hodgkin cells (H, blue dotted lines and crosses), and Reed–Sternberg cells (RS, green dash lines and squares). The bottom row (D–F) illustrates binucleated RS cells (RS2, red solid lines and circles) and RS cells with 4 or more subnuclei (RS4+, blue dotted lines and crosses). A,D: Cumulative size distribution of the DNA structure, (B,E) the cumulative size distribution of the DNA-free space. All these size distributions are measured with a granulometry. The difference in the sub-micron size range is caused by differences in the DNA structure size. Differences in size in the order of several μm are due to the difference in cell size. Both regimes are indicated with an arrow in the top left plot. C,F: Coefficient of variation and skewness of the intensity histogram of these cells. The black lines are the Fisher linear discriminants. See Figure S4 for measurements on the widefield images of the same cells. All differences between the granulometries are significant at the 5% significance level, except RS2 versus RS4+ for the DNA-free space.