
Figure 1.
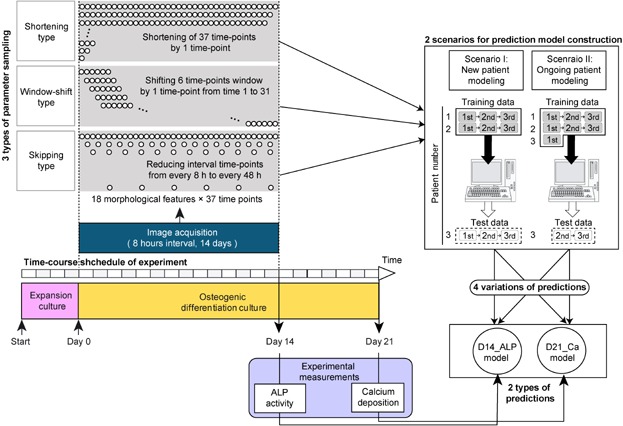
Schematic illustration of experimental procedures for constructing morphology-based prediction models for osteogenic differentiation potential. In the time-course experiment, an osteogenic differentiation culture period (21 days) followed the expansion culture period (4 days). For the first 14 days of differentiation culture phase contrast microscopic images were automatically acquired at 8 h intervals (total 37 time-points) using BioStation CT (Nikon). From acquired images, morphological features were extracted through image processing (total 666 morphological features). Three types of feature variation were compared: (i) Shortening type, a systematic examination of the impact of decreasing the overall duration of the experimental time-line; (ii) Window-shift type, a 6-time-point scan of the 14 day time-course to explore the possibility of a critical time window; and (iii) Skipping type, an evaluation of the critical sampling frequency between time-points. Circles in the upper-left panel represent image collection time-points. On day 14, samples were collected for experimental measurement of ALP activity. On day 21, samples were collected for calcium deposition measurement. The model predicting ALP activity on day 14 was designated as D14_ALP, and the model predicting calcium deposition rate on day 21 was designated as D21_Ca. For both prediction models, two different scenarios for model construction were examined. Scenario I: New patient modeling, which attempted to predict a new patient's cell potential from historical image data of previous patients, and Scenario II: Ongoing patient modeling, which attempted to predict new patient's cell potential by combining the historical image data of previous patients together with the patient's own image data from early culture stages.