
Figure 2.
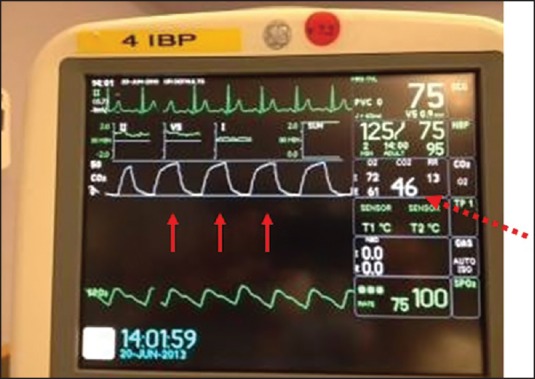
A sidestream capnograph with CO2 display showing waveforms (solid arrows) and end-tidal CO2 value (dashed arrow)
Official websites use .gov
A
.gov website belongs to an official
government organization in the United States.
Secure .gov websites use HTTPS
A lock (
) or https:// means you've safely
connected to the .gov website. Share sensitive
information only on official, secure websites.
A sidestream capnograph with CO2 display showing waveforms (solid arrows) and end-tidal CO2 value (dashed arrow)