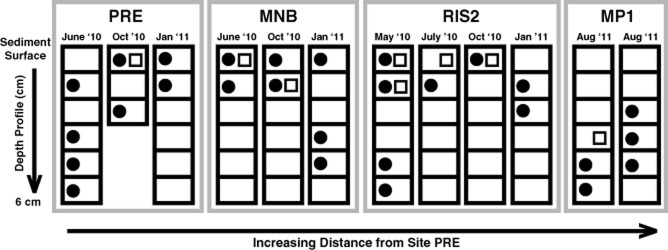
Figure 2.

Downcore nifH (closed circles) and nirS (open squares) gene expression in 1 cm intervals in the sediment as a function of increasing distance from site PRE. Blank spaces indicate that no gene expression was detected. Sampling month is indicated above each profile.
