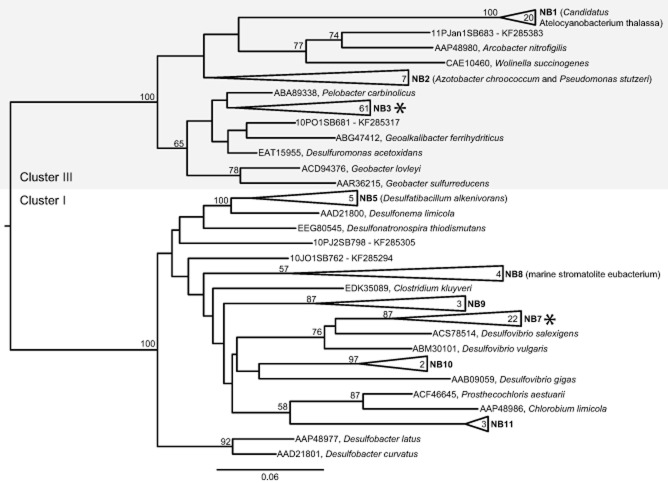
Figure 3.
Maximum likelihood protein tree of expressed nifH sequences obtained from sediment samples and nifH sequences from cultivated representatives. nifH cluster designations are denoted according to Zehr and colleagues (2003). Groups NB1-NB7 were previously described (Fulweiler et al., 2013), while groups NB9-NB11 are novel to this study. The number inside the group indicates the total number of sequences within the grouping. Supporting Information Table S3 describes all sequences within a collapsed group. Bootstrap values (1000 replicates) > 50% are shown at the respective nodes. Asterisk indicates groups targeted for quantitative PCR.

