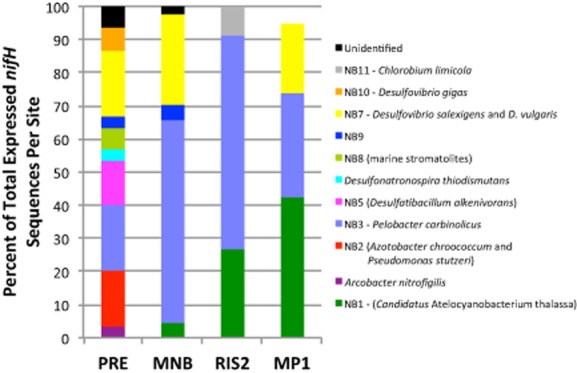
Figure 4.

Percent of total expressed nifH sequences per site as a function of increasing distance from site PRE. Each color represents a cultivated species our environmental expressed sequences are related to as depicted in the nifH maximum likelihood tree (Fig. 3). Organisms listed in parentheses are contained within the grouping.
