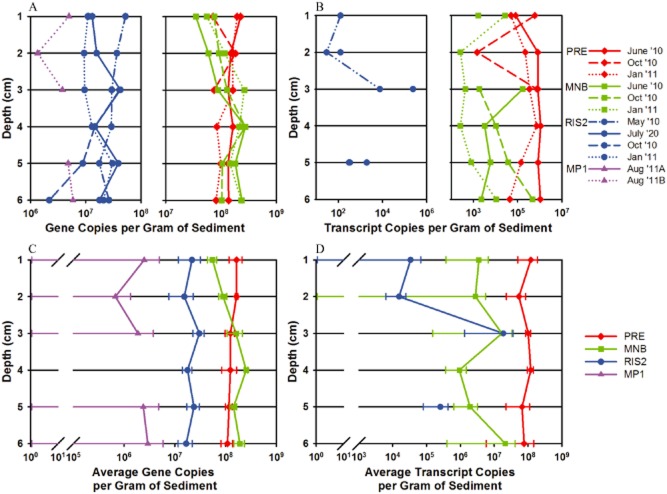
Figure 6.
Downcore abundance and nifH expression of group NB7 (related to D. salexigens and D. vulgaris) enumerated by quantitative PCR in 1 cm intervals from sediment samples collected at four sites, PRE (red), MNB (green), RIS2 (blue) and MP1 (purple). NB7 (A) abundance and (B) nifH expression during each sampling month as indicated by different line styles. NB7 (C) average abundance and (D) average nifH expression over the sampling time points. Graphs are plotted on a log scale and the standard error of the mean indicated by the error bars.

