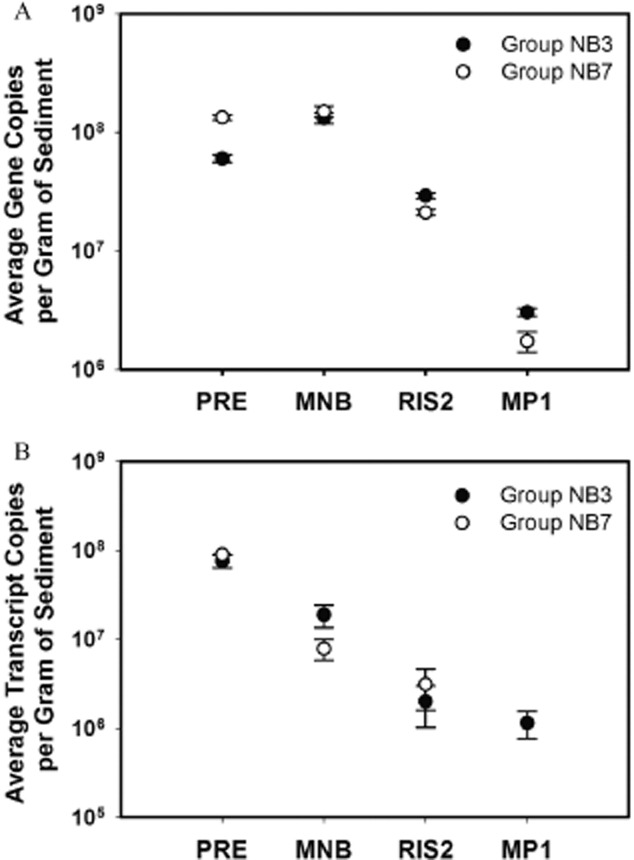
Figure 7.

NB3 (closed circles) and NB7 (open circles) (A) abundance and (B) nifH expression integrated over depth and sampling time at the four sites as a function of increasing distance from site PRE. Graphs are plotted on a log scale and the standard error of the mean indicated by the error bars.
