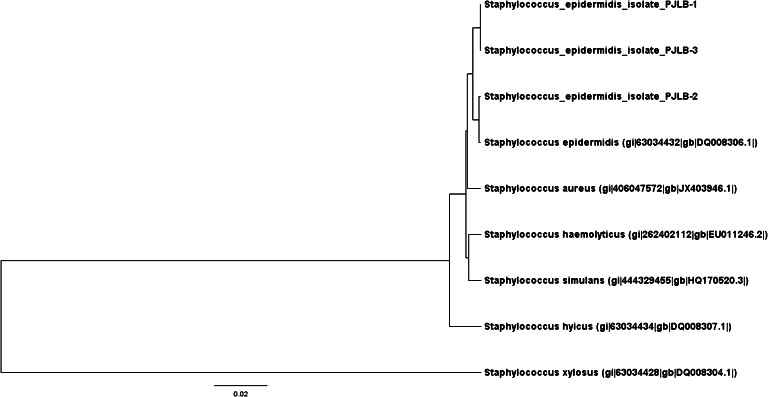
Fig. 2.
Dendrogram representing the bap gene diversity in conjunctival CNS isolates collected from cats in comparison to other sequences obtained from GenBank. Analyzed strains were recognized as S. epidermidis. The similarity tree was inferred using the UPGMA method. The optimal tree with the sum of branch length = 0.38994523 is shown. The tree is drawn to scale, with branch lengths in the same units as those of the evolutionary distances used to infer the phylogenetic tree. The evolutionary distances were computed using the maximum composite likelihood method and are in the units of the number of base substitutions per site (Tamura et al. 2004). The analysis involved nine nucleotide sequences. Codon positions included were 1st + 2nd + 3rd + Noncoding. All ambiguous positions were removed for each sequence pair. There were a total of 900 positions in the final dataset. Evolutionary analyses were conducted using MEGA6 software (Tamura et al. 2012)

