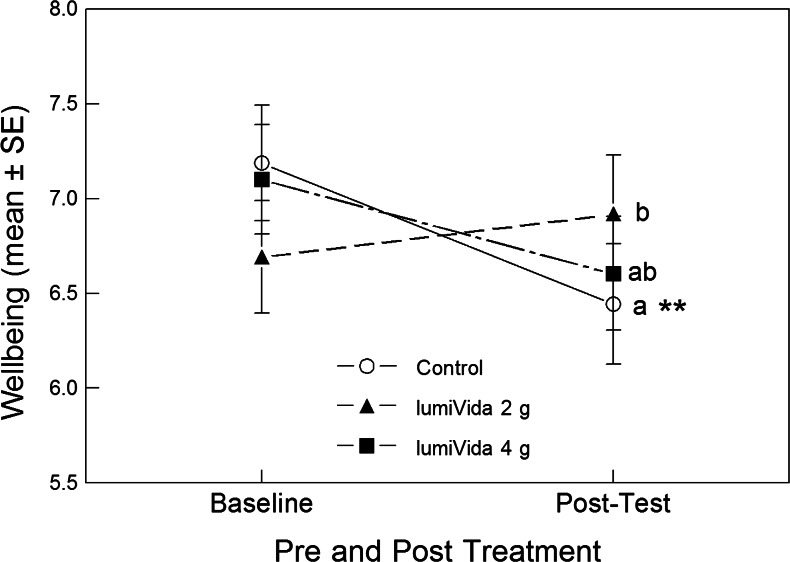
Fig. 3.
Effects of treatments on wellbeing at baseline and posttest. The significant pre–post by treatment interaction can be seen: 2 g LumiVida™ resisted any decline in wellbeing, and this effect was significantly different from control. The effect of 4 g was closer to control but did not differ significantly from either of the other groups. Different letters indicate differences between treatment groups, adjusted for baseline levels. Only in the control condition did the change (reduction) from baseline achieve significance (see below), **p < 0.01

