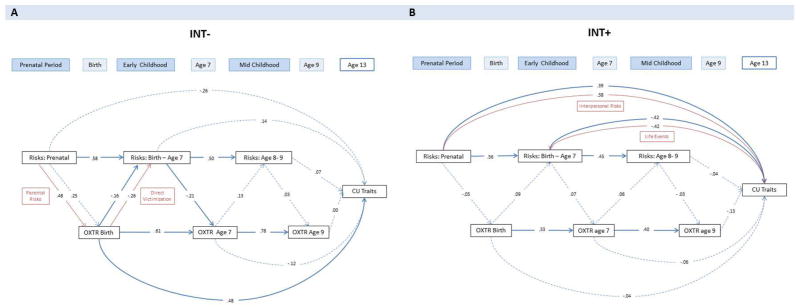
Figure 3.
Integrative developmental model. Panel A: INT− group. Panel B: INT+ group. Single arrowed lines indicate standardized path coefficients that survived bootstrap-corrected confidence intervals (i.e. significant path). Red arrows show significant individual risk domains based on post-hoc analyses. Dotted arrowed lines indicate non-significant paths. Population effect sizes are interpreted using the standardized estimates (Std. B) following Cohen’s guidelines: an effect of .10 is small effect, an effect of .24 is a medium effect, and an effect of .37 is a large effect.

