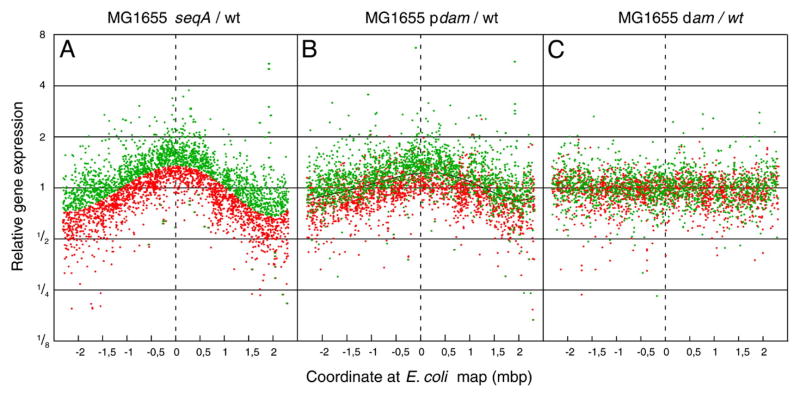
FIGURE 9.
Expression of individual genes as a function of position on the chromosome. All genes for which a significant signal was obtained were plotted relative to wild type as a function of position along the chromosome. The chromosome is linearized at a position directly opposite oriC. The replication origin has position 0 on the abscissa. (A) MG1655 seqA. (B) MG1655_pTP166 (Dam overproducer). (C) MG1655 dam-13::Tn9. Trendlines for the gene expression data are presented in A and B. All points above the trendline in panel A, i.e., genes that were derepressed in the seqA mutant are plotted as green dots, and all genes that were repressed in the seqA mutant as red dots. Expression data from individual genes in panels B and C have the same color assignment as in panel A (red and green dots). Reproduced from with permission from [49] and Copyright (2007) National Academy of Sciences, U.S.A.

