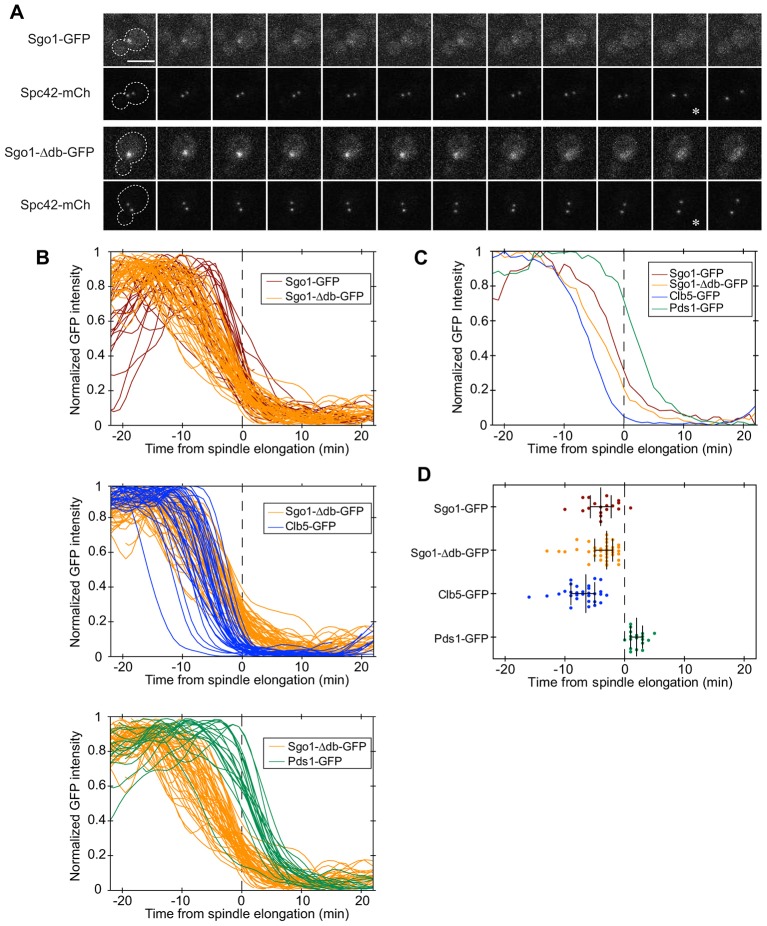
Fig. 3.
Sgo1 and Sgo1-Δdb disappear from the pericentromere with similar timing. (A) Sgo1 or Sgo1-Δdb was tagged with GFP and imaged at 1-min intervals using spinning disk confocal microscopy. Spindle pole bodies were marked by fusing Spc42 to mCherry. An asterisk denotes the onset of spindle elongation. Scale bar: 5 µm. (B) Quantification of GFP intensities relative to the onset of spindle elongation (Lu et al., 2014). The intensity of the brightest 5×5 pixel square in strains containing Sgo1–GFP (n = 28), Sgo1-Δdb–GFP (n = 53), Pds1–GFP (n = 20) or Clb5–GFP (n = 36) was measured as a function of time, smoothed, normalized to the maximum intensity, and plotted relative to the onset of spindle elongation (dashed line). Data before normalization are shown in supplementary material Fig. S2. (C) Averaged traces of results shown in B, where unsmoothed traces from all cells were first aligned to the same time reference point, averaged at each time point, and then normalized to maximum intensity (Lu et al., 2014). (D) To quantify and compare the timing of fluorescence changes for each protein, we determined the time point when 50% of the GFP intensity remained in each cell. This analysis was carried out with the subset of cells in which a clear fluorescence plateau was present before and after the decline. Each dot represents a single cell, the middle bar represents the median of each strain dataset, and the error bars represent the 25th and 75th percentiles.

