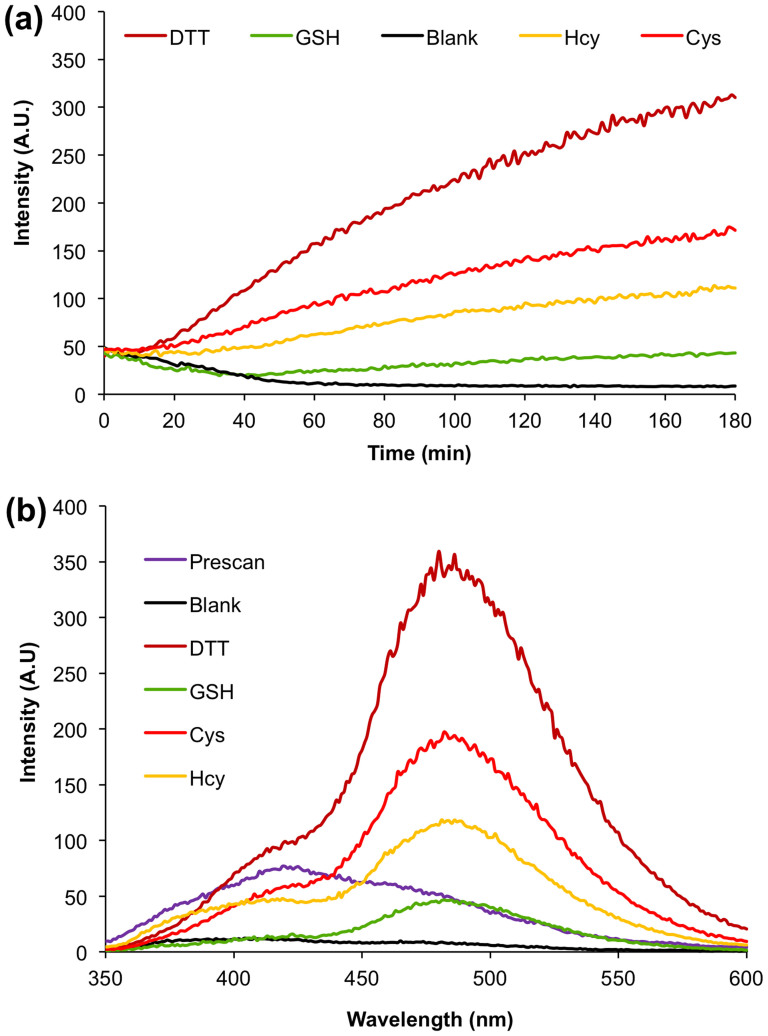
Figure 4.
(A) Kinetic measurements of the ZG-20 NPs with and without (Blank) various thiol compounds. λex = 330 nm, λem = 477 nm. (B) Fluorescence spectra of ZG-20 NPs (λex = 330 nm) after incubation with and without (Blank) various thiol compounds (5 mM). Prescan curve refers to the fluorescence spectrum of the NPs before the incubation, and Blank curve means that the fluorescence spectrum of the NPs was recorded after the same incubation time without the addition of thiol compounds.

