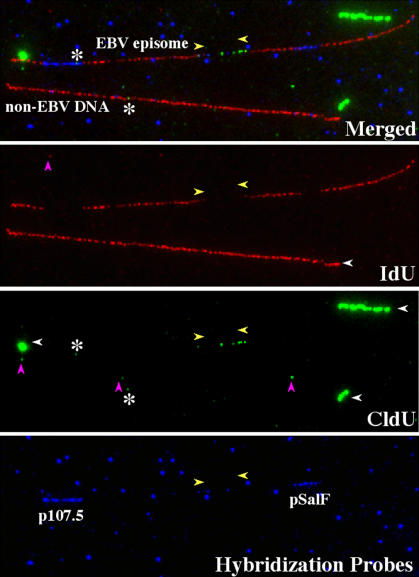
Figure 1. Fluorescent Hybridization Immunostaining of Individual EBV Episomes.
Image of two stretched DNA molecules in the same optical field. The hybridization signals (p107.5 and pSalF) and the immunostaining to detect the halogenated nucleotides are shown in different pseudocolors (red = IdU, green = CldU, and blue = hybridization probes). The top panel shows the merged image. The different color channels are shown separately in the lower panels. One of the two stretched molecules is a PacI-linearized EBV episome (molecule above) and can be recognized by the presence of the hybridization signals. The molecule below is a piece of cellular genomic DNA of similar size (no hybridization signals). The presence of the hybridization signals decreases the intensity of the immunostaining along the same portion of the EBV episome. This confirms that both halogenated nucleotides and hybridization probes are located on the same DNA molecule. The blue dots visible in the bottom panel represent hybridization background (this background was digitally removed from Figures 3B, 4B, and 6B). The EBV episome is substituted along its entire length with both IdU (red regions) and CldU (green regions). Yellow arrowheads indicate the approximate position of the replication forks at the time of the switch from the first to the second labeling period. The background visible in the red and green channels is mainly other DNA molecules containing halogenated nucleotides (white horizontal arrowheads). Some of these molecules attached to the glass before becoming fully extended and appear thick, displaying a brighter immunostaining. Small dots are also visible (magenta vertical arrowheads), sometimes overlapping with the DNA molecules (white asterisks); however, they were not considered in our analysis because they are too short to be unequivocally ascribed to DNA replication.

