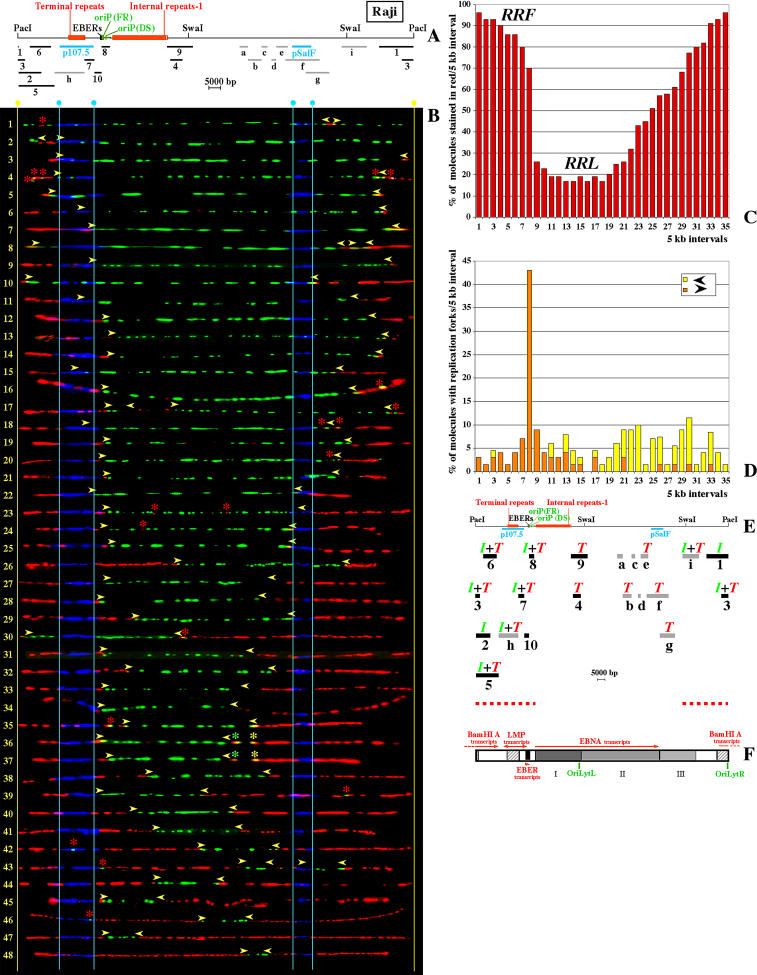
Figure 3. SMARD Performed on PacI-Linearized EBV Episomes Replicated in Raji Cells.
(A) Map of the PacI-linearized EBV genome with the positions of various genetic elements shown to scale. Below the EBV map, light blue bars indicate the positions of the hybridization probes (p107.5 and pSalF) utilized during SMARD to identify the molecules of interest and their orientation. Gray bars (a–h), and black bars (1–10), indicate the positions of the restriction fragments analyzed by 2D gel electrophoresis.
(B) PacI-linearized Raji EBV episomes after hybridization and immunostaining of the DNA molecules (aligned with the map). These molecules incorporated both halogenated nucleotides, and the images are ordered (from 1 to 48) by increasing content of DNA labeled during the first labeling period (red). One additional molecule was unsuitable for precise measurements and is not shown. Vertical light blue lines indicate the positions of the ends of the hybridization probes and yellow lines, the position of the PacI site. Arrowheads mark the approximate position of the red-to-green transitions. Asterisks indicate the position of short colored patches not necessarily related to DNA replication.
(C) Replication profile of the Raji EBV episomes. This profile was obtained using both the images shown in (B) and the images collected in a previous SMARD experiment (Norio and Schildkraut 2001), for a total of 69 episomes. Starting from the PacI site, genomic intervals of 5 kb are indicated on the horizontal axis by numbers from 1 to 35. The vertical axis indicates the percentage of molecules stained red within each 5-kb interval.
(D) Profile of replication fork abundance and direction throughout the EBV genome. Genomic intervals of 5 kb are indicated on the horizontal axis as for (C). The vertical axis indicates the percentage of molecules (out of a population of 69 episomes) containing replication forks (red-to-green transitions) within each 5-kb interval. The forks moving from left to right are depicted in orange. The forks moving from right to left are depicted in yellow.
(E) Map of the EBV genome aligned with the horizontal axes of histograms (C) and (D), and with the restriction fragments analyzed by 2D gel electrophoresis (black and gray bars below the map). Green Is indicate the presence of replication bubbles. Red Ts indicate the presence of replication intermediates produced by random termination events. Replication bubbles were detected by 2D gel electrophoresis across the region marked by the red dashed line (approximately corresponding to the RRF).
(F) Transcription of the Raji EBV genome. Red arrows mark the positions of regions that can be transcribed during latency. The level of transcription derived by nuclear run-on according to Kirchner et al. (1991) is shown as gray scale (black = highest level; white = lowest level or not transcribed). The EBER genes represent the most intensively transcribed portion of the EBV genome. Intermediate levels of transcription were detected across and downstream from the long transcription unit of the EBNA genes. According to Sample and Kieff (1990), the level of transcription along the EBNA genes region decreases from left to right (I–III). Intermediate levels of transcription were also reported for the two hatched regions. However, these regions contain either repeated sequences (the terminal repeats) or cross-hybridize with other transcribed regions (oriLytR and oriLytL); therefore, their actual level of transcription could be lower.

