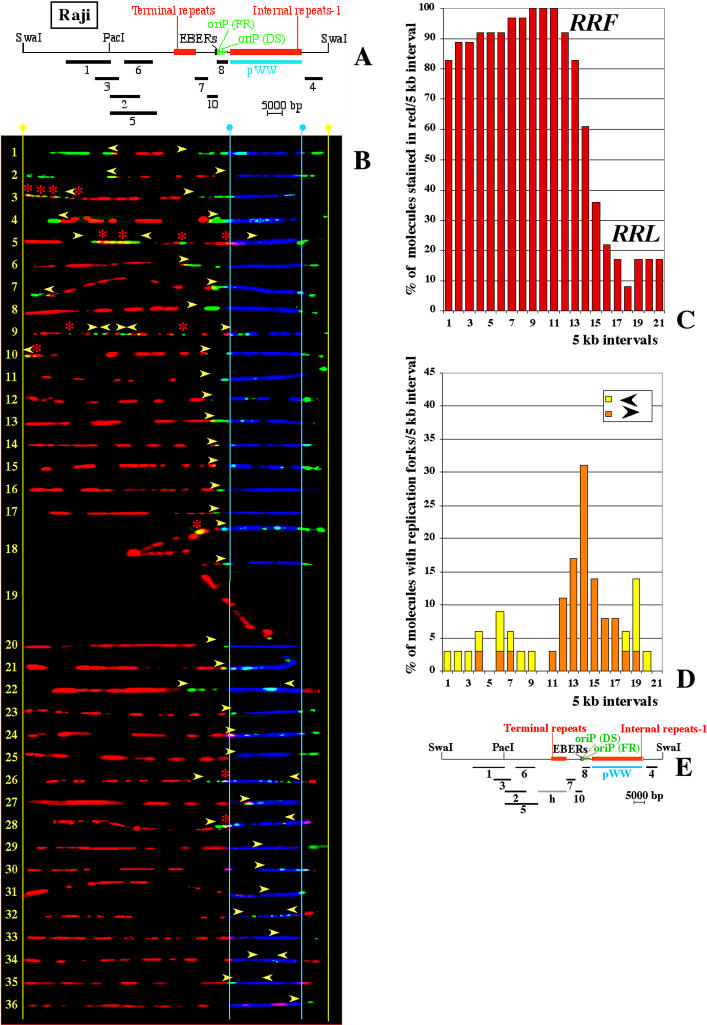
Figure 4. SMARD Performed on SwaI-Digested EBV Episomes Replicated in Raji Cells.
(A) Map of the approximately 105-kb fragment obtained by digesting EBV episomes with the restriction endonuclease SwaI.
(B) Images of 36 EBV molecules ordered and marked as in Figure 3B. Molecules 18 and 19 are distorted, but the positions of the red-to-green transitions are clear.
(C) Replication profile of the SwaI-digested EBV episomes shown in (B). Starting from the SwaI site, intervals of 5 kb are indicated on the horizontal axis by numbers from 1 to 21. The vertical axis indicates the percentage of molecules stained red within each 5-kb interval.
(D) Profile of replication fork abundance and direction. Intervals of 5 kb are indicated on the horizontal axis as for (C). The vertical axis indicates the percentage of molecules containing replication forks in each 5-kb interval. The partitioning of the EBV genome is different from Figure 3D. Hence, the four pausing sites that in Figure 3D were located within interval 8 are here located between interval 13 and interval 14. As a consequence, the peak visible in Figure 3D is here split into two smaller adjacent peaks.
(E) Map of the approximately 105-kb SwaI fragment aligned with the horizontal axes of histograms (C) and (D).

