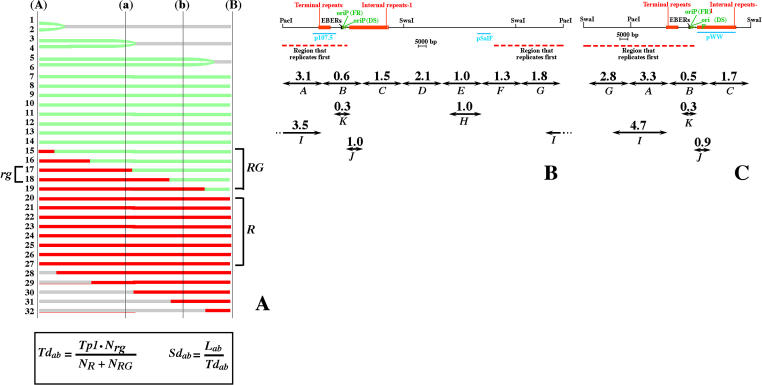
Figure 5. Duplication Speed of Various Segments of the Raji EBV Genome.
(A) A detailed procedure to calculate Td using SMARD was published elsewhere (Norio and Schildkraut 2001). Here we describe how to calculate Tdab for a generic genomic region (a)–(b) (i.e., any portion of the EBV genome) using information derived from the replication patterns of a longer region (A)–(B) (i.e., the whole EBV genome). Depicted are the hypothetical staining patterns for 32 DNA molecules representing the genomic region (A)–(B) after double-labeling with two halogenated nucleotides (red and green). The molecules that started and completed their duplication during the first labeling period are fully red (R). The molecules that started their duplication during the first labeling period, completing it during the second labeling period are stained in both red and green (RG). In the total population of molecules, the fraction of R molecules increases when the length of the first labeling period (Tp1) increases. The fraction of RG molecules is proportional to the time required to duplicate the genomic region (A)–(B). Some of these molecules (marked rg) are stained in red and green also within the region (a)–(b). The fraction of rg molecules is proportional to the time required to duplicate the genomic region (a)–(b). This relationship is expressed by the equation reported at the bottom of the figure and allows us to calculate Tdab using parameters that can be easily measured on individual DNA molecules (NR, the number of R molecules; NRG, the number of RG molecules; Nrg, the number of rg molecules). Finally, the ratio between the size of the genomic segments analyzed (Lab) and Tdab represents the duplication speed of the segment (Sdab). The results obtained from the PacI and the SwaI experiments are reported in (B) and (C). Double-headed arrows indicate the genomic segments analyzed quantitatively. Segments marked with the same letter in the two maps correspond to identical portions of the Raji EBV genome. Above each arrow is indicated the corresponding Sd value in kilobases per minute. The sizes of these segments are as follows: A–G, 25 kb; H, 20 kb; I, 35 kb; K, 10 kb; L, 75 kb; and J, 10 kb. A comparison of the values obtained from the two experiments shows remarkable similarities. The largest variation was found for segment G. However, in both experiments this segment was located at the end of the DNA molecules. Therefore, the variability in stretching in this portion of the molecules may have affected the collection of the data. The red dashed line below the map indicates the position of the RRF.

