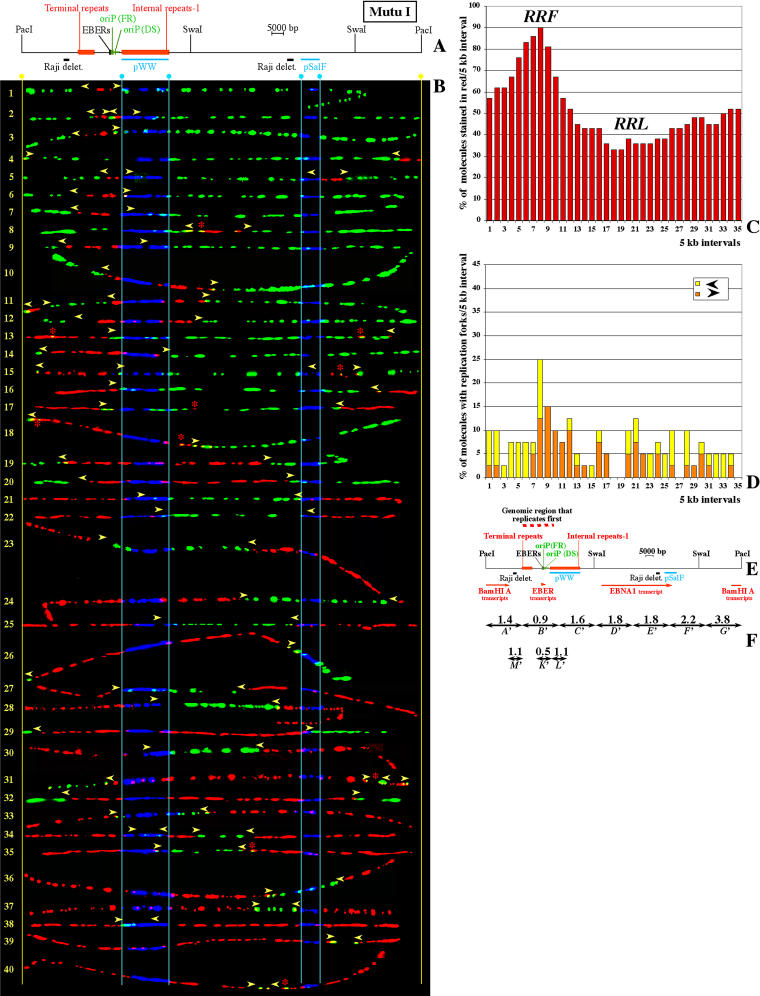
Figure 6. SMARD Performed on PacI-Linearized EBV Episomes Replicated in Mutu I Cells.
(A) Map of the PacI-linearized EBV genome with the positions of various genetic elements shown to scale. Below the EBV map, light blue bars show the positions of the hybridization probes (pWW and pSalF) utilized to identify the EBV molecules and their orientation. Black bars indicate the positions of two short deletions present in the Raji EBV genome (Polack et al. 1984).
(B) Images of 40 PacI-linearized EBV episomes ordered and marked as in Figure 3B (from a population of 42 molecules collected in this experiment). Some molecules are distorted but the positions of the red-to-green transitions are clear. Two additional molecules were unsuitable for precise measurements and are not shown.
(C) Replication profile of the PacI-linearized EBV episomes shown in (B). Starting from the PacI site, intervals of 5 kb are indicated on the horizontal axis by numbers from 1 to 35. The vertical axis indicates the percentage of molecules stained red within each 5-kb interval.
(D) Profile of replication fork abundance and direction. Intervals of 5 kb are indicated on the horizontal axis as for (C). The vertical axis indicates the percentage of molecules containing replication forks in each 5-kb interval. Three different pausing sites contribute to the significant accumulation of replication forks within interval 8 (the two EBER genes and the FR element). A fourth pausing site (the DS element) is located within interval 9, producing a minor accumulation of replication forks.
(E) Map of the EBV genome (to scale) aligned with the horizontal axes of histograms (C) and (D). Red arrows mark the positions of regions transcribed during the type I latency that characterize the Mutu I EBV episomes. The red dashed line above the map indicates the position of the RRF.
(F) Duplication speed for various segments of the Mutu I EBV genome. Double-headed arrows indicate the genomic segments analyzed quantitatively. Above each arrow is indicated the corresponding Sd value in kilobases per minute. Segments A′–G′ divide the whole EBV genome into seven parts of identical size, corresponding, respectively, to the intervals 1–5, 6–10, 11–15, 16–20, 21–25, 26–30, and 31–35 on the horizontal axes of Figures 3C and 4C. The sizes of these segments are as follows: A′–G′, 25 kb; and K′, L′, and M′, 10 kb. Due to the presence of small differences in the DNA sequence (see text), segments A′–G′ are similar but not identical to segments A–G in Figure 5.

