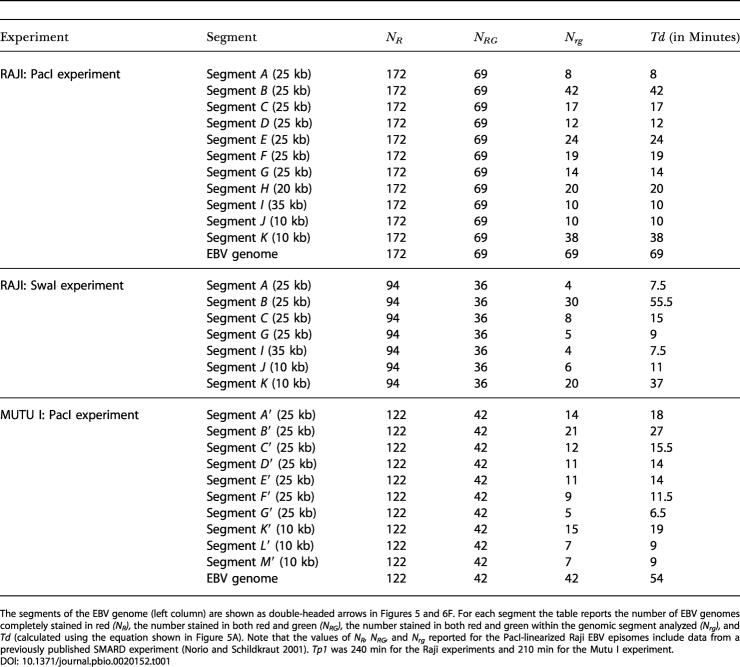
Table 1. Quantitative Analysis of Different SMARD Experiments.
The segments of the EBV genome (left column) are shown as double-headed arrows in Figures 5 and 6F. For each segment the table reports the number of EBV genomes completely stained in red (NR), the number stained in both red and green (NRG), the number stained in both red and green within the genomic segment analyzed (Nrg), and Td (calculated using the equation shown in Figure 5A). Note that the values of NR, NRG, and Nrg reported for the PacI-linearized Raji EBV episomes include data from a previously published SMARD experiment (Norio and Schildkraut 2001). Tp1 was 240 min for the Raji experiments and 210 min for the Mutu I experiment

