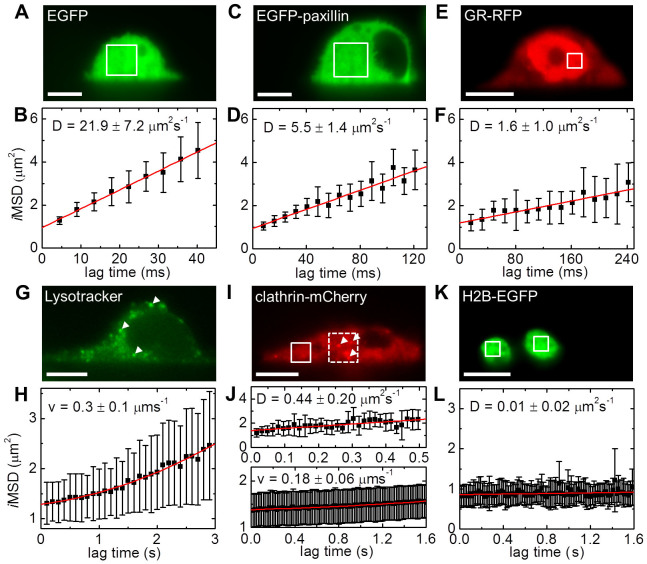
Figure 2. Molecular motion in live cells.
(A) Fluorescence image of an EGFP expressing CHO-K1 cell. Image time series were recorded followed by STICS analysis in regions of 32 × 32 to 56 × 56 pixels (white box). (B) Average iMSD results in a diffusion coefficient of 21.9 ± 7.2 μm2s−1 (n = 13). (C) Fluorescence image of an EGFP-paxillin expressing CHO-K1 cell. STICS analysis in regions of 32 × 32 to 72 × 72 pixels (white box). (D) Average iMSD results in a diffusion coefficient of 5.5 ± 1.4 μm2s−1 (n = 11). (E) Fluorescence image of a GR-RFP expressing CHO-K1 cell. Image time series were subjected to STICS analysis in regions of 16 × 16 to 48 × 48 pixels (white boxes). (F) Average iMSD results in a diffusion coefficient of 1.6 ± 1.0 μm2s−1 (n = 6). (G) Fluorescence image of a CHO-K1 cell incubated with Lysotracker green. STICS data was analyzed in regions containing moving lysosomes (white arrows, 24 × 24 to 32 × 32 pixels). (H) A polynomial fit of the average iMSD returns an average lysosome velocity of 0.3 ± 0.1 μms−1 (n = 6). (I) Fluorescence image of a clathrin-mCherry expressing OK cell. STICS data was analyzed in two types of regions (24 × 24 to 64 × 64 pixels), one type exhibiting a homogeneous fluorescence signal (white box, solid line) and another type (white box, dashed line) containing slow moving vesicles (arrows). (J) iMSD of the two regions shown in panel (I). Linear fits of the data representing free clathrin (top) result in a diffusion coefficient of 0.44 ± 0.20 μm2s−1 (n = 7), whereas a polynomial fit to the data representing clathrin-coated vesicles (bottom) results in an average velocity of 0.18 ± 0.06 μms−1 (n = 6). (K) Fluorescence image of a H2B-EGFP expressing CHO-K1 cell. (L) A constant iMSD is obtained (D = 0.01 ± 0.02 μm2s−1, n = 8). Scale bars, 10 μm. All errors stated are standard deviations.

