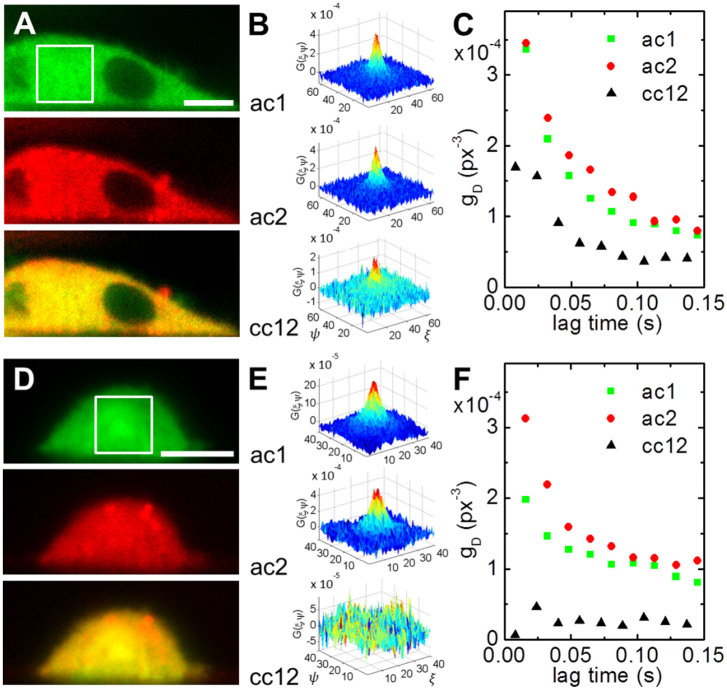
Figure 4. cciMSD in live cells.
(A) Fluorescence images of an EGFP-paxillin-mCherry expressing CHO-K1 cell (top, green channel; middle, red channel; bottom, overlay). A series of SPIM images was acquired alternatingly in both channels. (B) The resulting spatiotemporal autocorrelations in each channel (at 16 ms lag time) as well as the cross-correlation (at 8 ms lag time) are shown for the region marked by the box in panel (A). (C) Amplitudes returned from Gaussian fitting of each STICS series plotted over the lag time (squares, green channel; dots, red channel; triangles, cross-correlation). (D) Fluorescence images of an EGFP-paxillin and mCherry-paxillin expressing CHO-K1 cell. (E,F) The absence of any cross-correlation indicates no binding between both fusion proteins. Scale bars, 10 μm.

