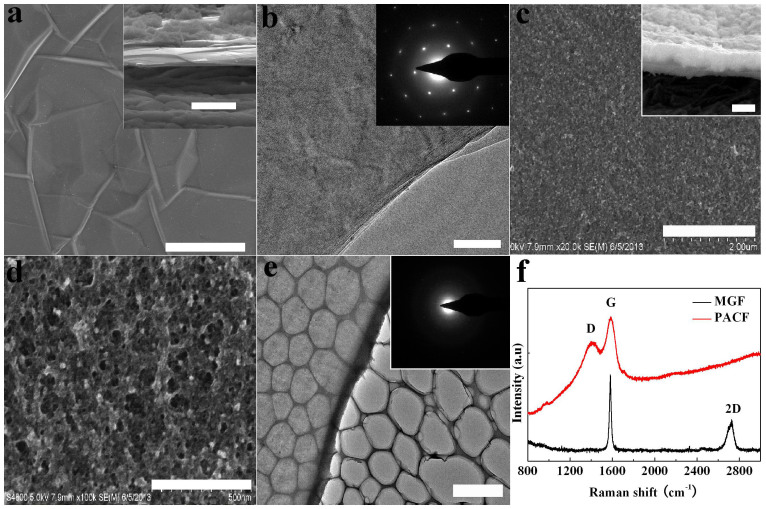
Figure 4. The microstructures of the MGF and PACF in HCF.
(a) SEM image of MGF (scale bar represents 4 μm), inset shows the cross-sectional SEM image of the MGF, scale bar represents 1 μm, (b) TEM image of MGF, the scale bar represents 50 nm, inset shows the SAED pattern, (c) SEM image of PACF, the scale bar represents 2 μm, inset shows the cross-sectional SEM image of the PACF, scale bar represents 1 μm, (d) high magnification SEM image of PACF, the scale bar represents 500 nm, (e) TEM image of PACF, the scale bar represents 2 μm, inset is the SAED pattern, and (f) Raman spectra of MGF and PACF.

