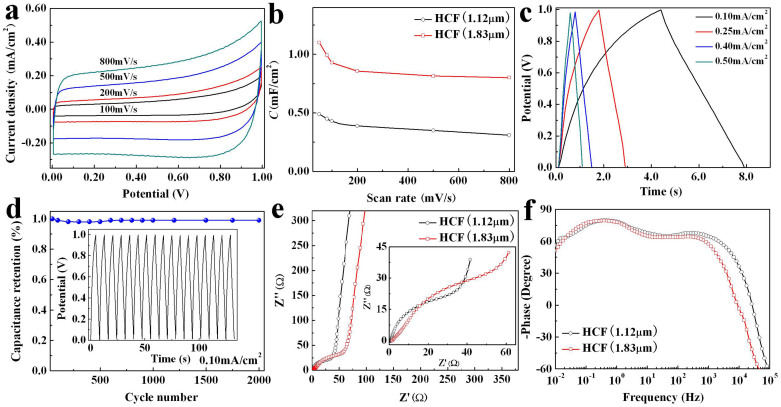
Figure 6. Electrochemical performance of HCF-based SC.
(a) Cyclic voltammograms (CV) curves of sandwich-structured HCF (1.12 μm) using a two-electrode symmetrical SC at operating potential between 0.0 and 1.0 V at different scan rates, (b) areal specific capacitance of the HCF electrodes with scan rate, (c) galvanostatic charge/discharge (GCD) curves of the SC based on the HCF (1.12 μm) at different current densities, (d) cycling stability performance of the SC based on the HCF (1.12 μm), inset shows the last dozen GCD curves after 2000 cycles at constant current density of 0.10 mA/cm2, (e) Nyquist plots of the HCF-based SCs, and inset shows the magnified portion of the Nyquist plots near the origin, (f) impedance phase angle versus frequency.

