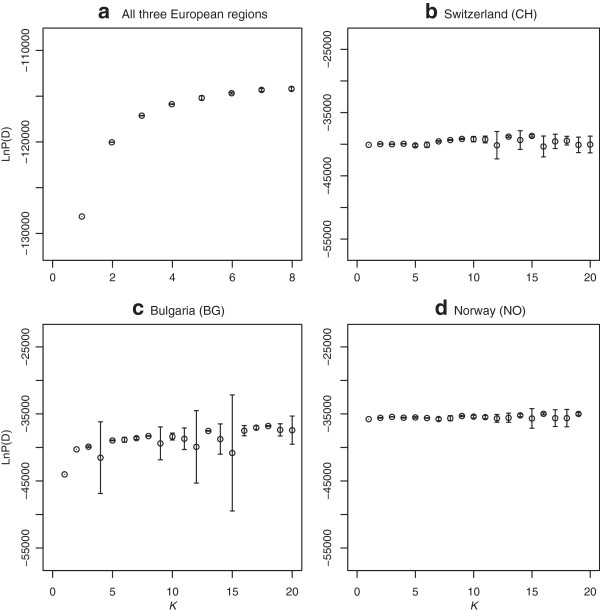
Figure 4.

Log probability of K being the number of Dactylis glomerata populations detected. Plot of the mean (± SD) of the natural log probability of the data [LnP(D)] over 6 repetitive STRUCTURE runs of a)K = 1-8 for all three regions; b/c)K = 1-20 for Switzerland and Bulgaria, and d)K = 1-19 for Norway.
