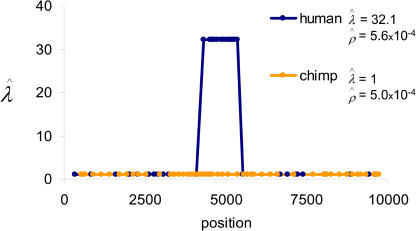
Figure 2. Estimates of the Recombination Hotspot Intensity, λ, Based on Genotype Data.
We assumed that, if the hotspot is present, it is in the same location as estimated by sperm typing in humans (see Materials and Methods). A λ value of one corresponds to the absence of recombination rate variation, while values of λ greater than one indicate a hotspot. The estimates for humans from the UK are shown in blue and those for western chimpanzees in orange.

