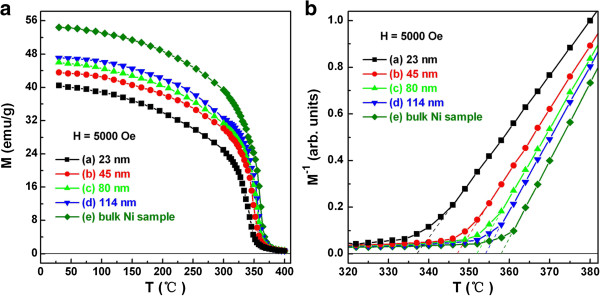
Figure 6.

M-T(a) andM−1-T(b) curves. Ni nanoparticles with particle sizes of (a) 23, (b) 45, (c) 80, (d) 114 nm, and (e) the corresponding bulk Ni sample.

M-T(a) andM−1-T(b) curves. Ni nanoparticles with particle sizes of (a) 23, (b) 45, (c) 80, (d) 114 nm, and (e) the corresponding bulk Ni sample.