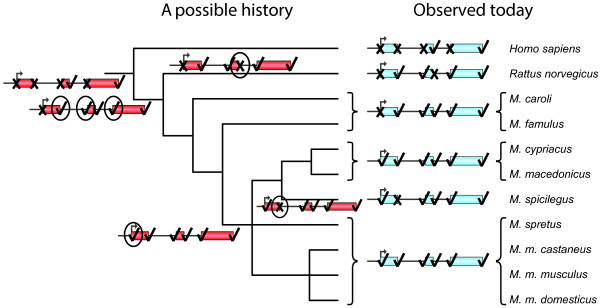
Figure 3.

A schematic diagram showing the evolution of signals in the Poldi gene, modified from Heinen et al. [11], with permission from Elsevier. The visual presentation follows closely that of Heinen et al. [11]. Exons and introns are not drawn to scale. Observed genes are shown in blue, and a possible history, consistent with the nonfunctional-ancestor consensus view in the literature, is shown in red. Checks and crosses represent presence and absence of signals, respectively. According to a parsimony-based interpretation of the data, a possibility arises that signals have been added on the timescale of millions of years. Note that the total number of signals is monotonically increasing with decreasing phylogenetic distance to Mus musculus (as the clade including M. cypriacus, M. macedonicus, and M. spicilegus can be rotated around its base).
