
Figure 5.
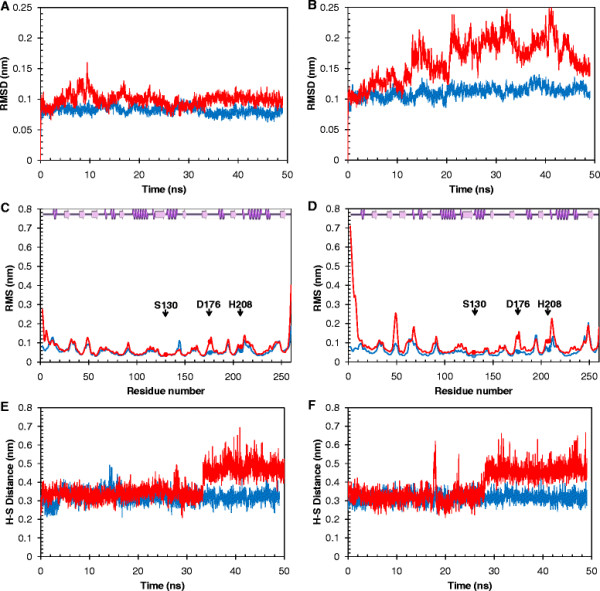
Molecular dynamics simulation of (A, C, E) Tcur1278 and (B, D, F) Tcur0390 polyester hydrolases. (A, B) Time courses of backbone RMSD changes during a simulation for 50 ns at 298 K (blue) and 353 K (red). (C, D) RMSF of Cα atoms per amino acid residue during a simulation for 50 ns at 298 K (blue) and 353 K (red). The purple spirals and arrows at the top of the RMSF graphs indicate α-helices and β-sheets, respectively. The catalytic triad residues are shown as solid spheres. (E, F) The distance of the catalytic H208 and S130 (H-S) during a simulation for 50 ns at 298 K (blue) and 353 K (red). For a clearer view, single simulation data from three simulations are shown.