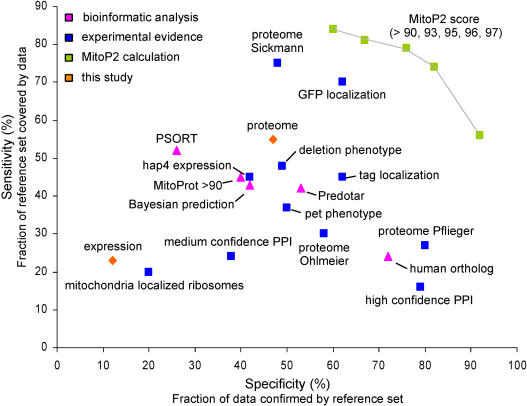
Figure 4. Specificity and Sensitivity of Systematic Approaches with Regard to Mitochondria.
Various datasets were benchmarked against the mitochondrial reference set. Each dot in the graph represents an entire dataset: PSORT (Nakai and Harton 1999), hap4 expression (Lascaris et al. 2003), deletion phenotype screen (Steinmetz et al. 2002), tag localization (Kumar et al. 2002), GFP localization (Huh et al. 2003), MitoProt greater than 90 (Scharfe et al. 2000), Bayesian prediction (Drawid and Gerstein 2000), pet phenotypes (Dimmer et al. 2002), three MS proteome studies (Pflieger et al. 2002; Sickmann et al. 2003; Ohlmeier et al. 2003), mitochondria localized ribosomes (Marc et al. 2002), Predotar (Small et al. 2004), and yeast proteins with known human mitochondrial orthologs (MitoP2 database). High-throughput protein–protein interaction datasets (PPI) were combined and divided into confidence classes (von Mering et al. 2002). Medium and high confidence PPI datasets were defined by interactions with known mitochondrial proteins (MitoP2 database). The predictive score for a mitochondrial protein (MitoP2) was based on the integration of 22 datasets, most of which are shown, and was calculated for different thresholds. Specificity and sensitivity are current best estimates owing to the incompleteness of the reference set.

