Figure 2.

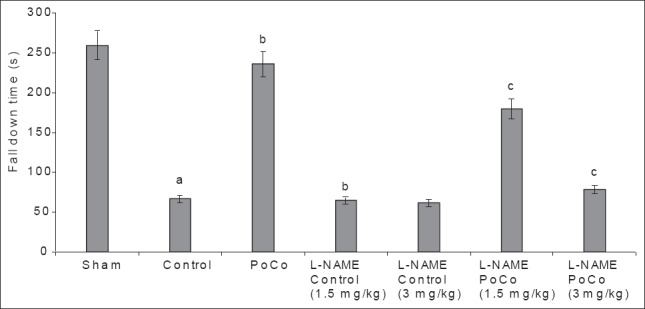
Effect of various interventions on motor performance (fall down time) using the rota rod test. Each group represents mean ± S.E.M. a=P<0.05 vs sham, b=P<0.05 vs control, c=P<0.05 vs PoCo. PoCo: Postconditioning

Effect of various interventions on motor performance (fall down time) using the rota rod test. Each group represents mean ± S.E.M. a=P<0.05 vs sham, b=P<0.05 vs control, c=P<0.05 vs PoCo. PoCo: Postconditioning