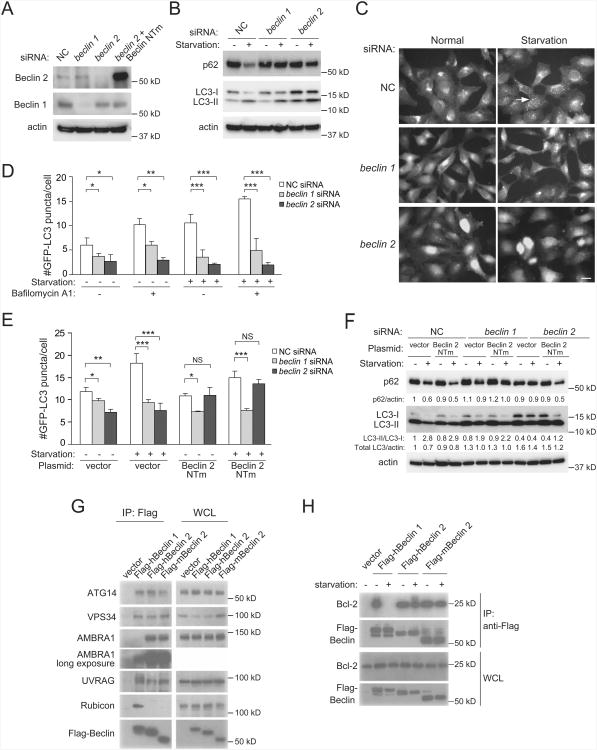
Figure 2. Beclin 2 functions in autophagy and interacts with known Beclin 1 binding partners.
(A) Western blot detection of Beclin 1 and Beclin 2 in HeLa cells transfected with indicated siRNA. Beclin 2 NTm, an siRNA non-targetable mutant beclin 2 rescue plasmid.
(B) Western blot detection of p62 and LC3 in HeLa cells transfected with indicated siRNA during growth in normal medium (starvation “−”) or after 3 h amino acid and serum starvation (starvation “+”). See Figure S2B for quantitative analysis of western blots from three independent experiments.
(C) Representative images of GFP-LC3 puncta in HeLa/GFP-LC3 cells transfected with indicated siRNA and cultured for 3 h in normal or starvation medium. Arrow, representative autophagosome. Scale bar, 20 μm.
(D) Quantification of GFP-LC3 puncta in HeLa/GFP-LC3 cells transfected with indicated siRNA, treated with 100 nM bafilomycin A1 or vehicle (DMSO), and cultured for 3 h in normal or starvation medium.
(E) Quantification of GFP-LC3 puncta in HeLa/GFP-LC3 cells cotransfected with indicated siRNA and indicated plasmid, and cultured for 3 h in normal or starvation medium.
(F) Western blot detection of p62 in HeLa cells cotransfected with indicated siRNA andindicated plasmid, and cultured for 3 h in normal or starvation medium. Quantification ofrelative levels of p62/actin, LC3-II/LC3-I and total LC3/actin is shown below each gellane.
(G) Co-immunoprecipitation of class III PI3K complex components with indicated Beclinproteins in HeLa cells transfected with indicated Flag-Beclin plasmids using an anti-Flagantibody.
(H) Co-immunoprecipitation of Bcl-2 with indicated Beclin proteins in HeLa cells transfected with indicated Flag-Beclin constructs using an anti-Flag antibody in nutrient-rich conditions or after 3 h of starvation.
For (D) and (E), bars represent mean represent mean ± SEM of triplicate samples (∼50 cells per sample) and similar results were observed in three independent experiments.
*P<0.05; **P<0.01; ***P<0.001; NS, not significant; ANOVA with Dunnett method.
NC, non-silencing control; WCL, whole cell lysate.
See also Figure S2.

