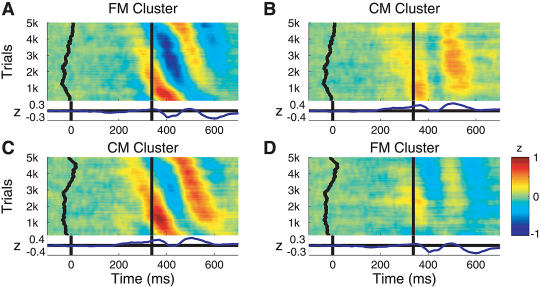
Figure 12. Phase Coupling of Theta Components: Time-Domain View.
(A) ERP-image view of baseline-normalized, response-aligned single-trial activity time series of components in the FM cluster, sorted (top-to-bottom) by phase at 4.87 Hz in a window centered 89 ms after the button press. Vertical smoothing: 400 trials. Units: microvolts normalized by dividing by the standard deviation of component single-trial baseline activity. The curving vertical trace (left) shows a moving mean of stimulus onset times; the central vertical line, the time of the button press. Data band pass in all panels: 0.1–40 Hz.
(B) Exporting the same trial sorting order from (A) to CM cluster components (from the nine subjects contributing components to both clusters) demonstrates the significant partial theta phase coherence (r is approximately 0.3) between the two clusters in the postresponse time/frequency window. Note the induced (top-down, left-to-right) slope of the latency of the two (orange) positive-going CM cluster theta wave fronts.
(C) Phase-sorted ERP image, as in (A), of the normalized CM cluster trials.
(D) FM cluster component trials sorted in the same trial order as (C). Again, the partial theta-band phase coherence of the two clusters in the postresponse period is reflected in the diagonal (blue) negative-going wave fronts of the FM cluster data.

