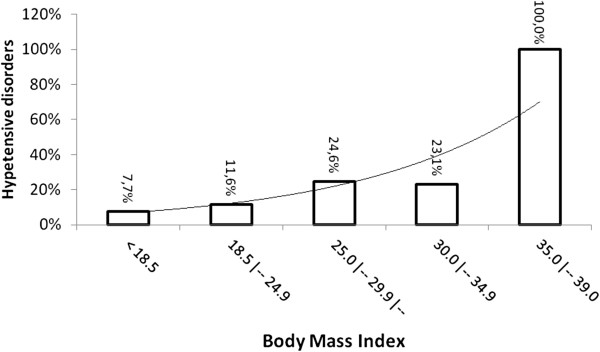
Figure 2.

The percent of women with hypertensive disorder of pregnancy versus age. X axis represents age and Y axis represents the percent of women with hypertensive disorder of pregnancy within that age group.

The percent of women with hypertensive disorder of pregnancy versus age. X axis represents age and Y axis represents the percent of women with hypertensive disorder of pregnancy within that age group.