
Figure 3.
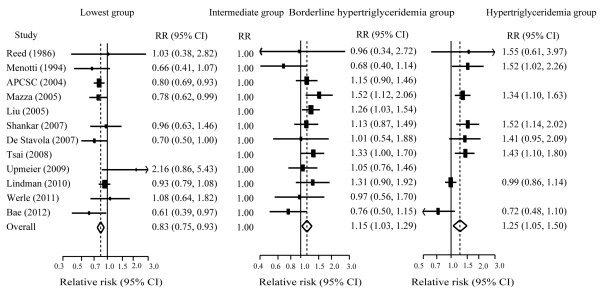
Pooled estimate of RR with 95% CI of CVDs mortality for categorical analysis. Squares indicate the adjusted relative risk (RR) and horizontal lines indicate the 95% confidence interval (CI). Triglycerides (TG) groups: lowest (<90 mg/dL), intermediate (90–149 mg/dL, the referent), borderline high (150–199 mg/dL), and high (≥ 200 mg/dL). CVDs: cardiovascular diseases.