
Figure 4.
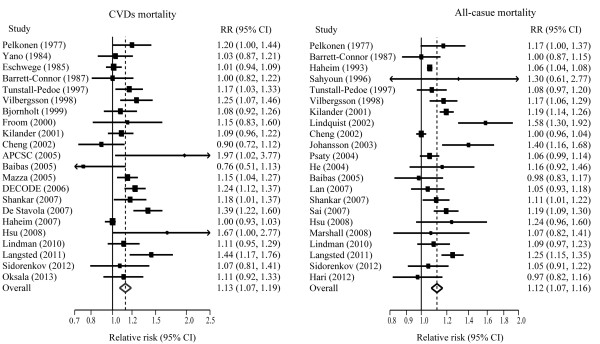
Pooled estimate of RR with 95% CI of CVDs and all-cause mortality for a 1-mmol/L increase of TG. Squares indicate the adjusted relative risk (RR) and horizontal lines indicate the 95% confidence interval (CI). TG: Triglycerides; CVDs: cardiovascular diseases.