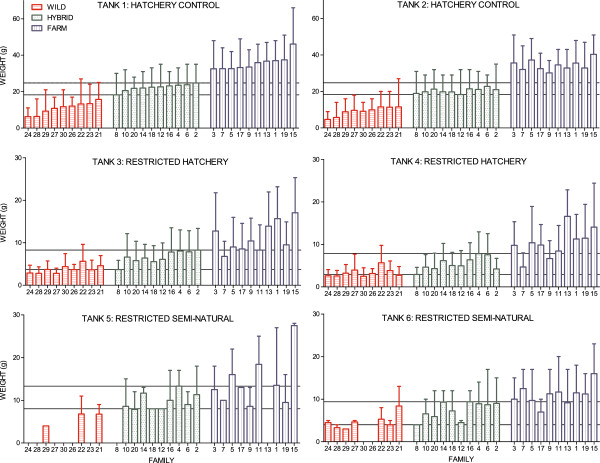
Figure 7.

Mean family weight in all six tanks, experiment II. Mean family weight (g) of the farmed, hybrid and wild families in all six tanks. Overall fish sizes were higher in the hatchery control treatment, than in the restricted hatchery treatment and the restricted semi-natural treatment. Fish sizes in the restricted hatchery treatment were lower than in the restricted semi-natural treatment. Farmed salmon were significantly larger than the hybrid and wild salmon, in all treatments. There is no overlap in mean family weight of the wild, hybrid and farmed families in the hatchery control treatment, while overlap between families of all origin were detected in the restricted hatchery treatment and the restricted semi-natural treatment. Families are ranked by their mean family weight in tank 1, by increasing order. Lines represent the mean of the smallest and largest hybrid family within each tank. Error bars show the range.
