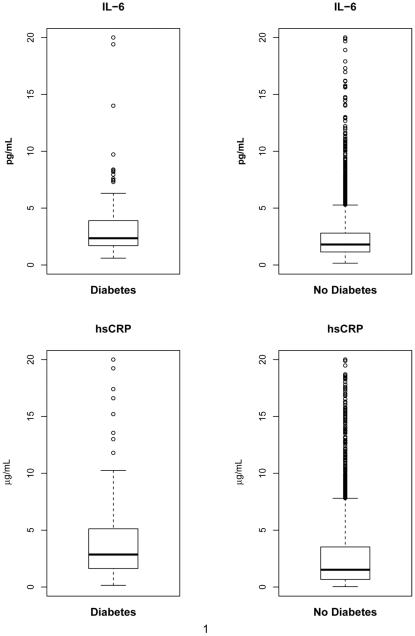
Figure 1.
Boxplots of IL-6 and hsCRP according to the development of diabetes during follow-up. Percentiles of the IL-6 distribution for those with diabetes are: 10th percentile=1.14, 25th percentile=1.70, median = 2.35, 75th percentile=3.90, 90th percentile=6.30. For those without diabetes, the percentiles are: 10th percentile=0.80, 25th percentile=1.14, median = 1.80, 75th percentile=2.80, 90th percentile=4.46. Percentiles of the hsCRP distribution for those with diabetes are: 10th percentile=0.84, 25th percentile=1.63, median = 2.86, 75th percentile=5.12, 90th percentile=11.80. For those without diabetes, the percentiles are: 10th percentile=0.31, 25th percentile=0.67, median = 1.52, 75th percentile=3.52, 90th percentile=7.35.

