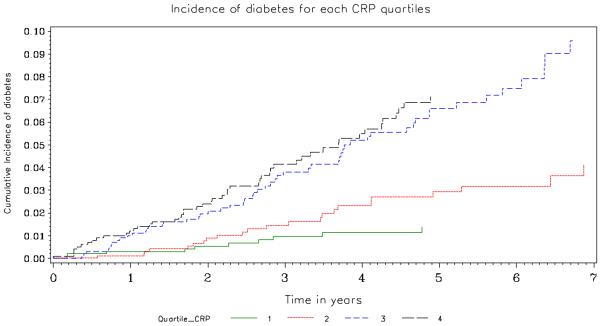
Figure 3.
Cumulative Percent Developing Diabetes by Quartile of hsCRP. The number at risk in Quartiles 1, 2, 3 and 4 was 995, 987, 993, 990, respectively at baseline, 801, 822, 807 and 791 at year 2, 511, 522, 519 and 441 at year 4 and 268, 284, 246 and 191 at year 6. The p-value corresponding to a logrank test with 3 degrees of freedom that compares the incidence of diabetes by quartile is <0.001.

