
Figure 7. Mice seek and return to the portion of the apparatus where they receive light activation of VTA projections from DR VGluT3 neurons.
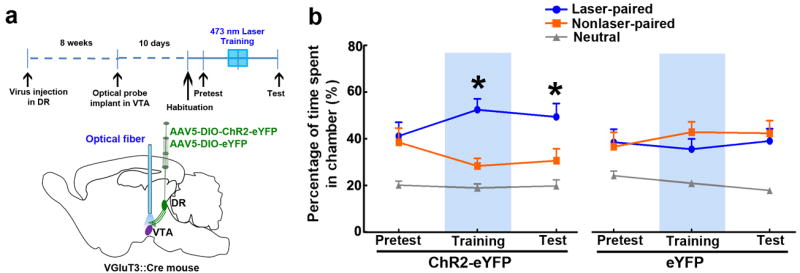
(a) Diagrams showing experimental timeline, virus injection in DR of VGluT3∷Cre mice, and VTA light stimulation of DR VGluT3 inputs. (b) VGluT3-ChR2-eYFP mice (but not VGluT3-eYFP mice) sought out and spent more time in the chamber where VTA light stimulation was given during training. On the test day, VGluT3-ChR2-eYFP mice but not VGluT3-eYFP mice also returned to and spent more time in the chamber where light stimulation was given on the previous day (main effect group: F1,18=4.87, P< 0.05, three-way ANOVA). Relative time spent in each chamber is represented as mean + s.e.m. (n = 10 each group). Blue rectangles indicate light stimulation available in the laser-associated chamber. VGluT3-ChR2-eYFP mice showed preference for the laser-associated chamber on both training day and test day (* P< 0.05, Newman-Keuls post hoc test).