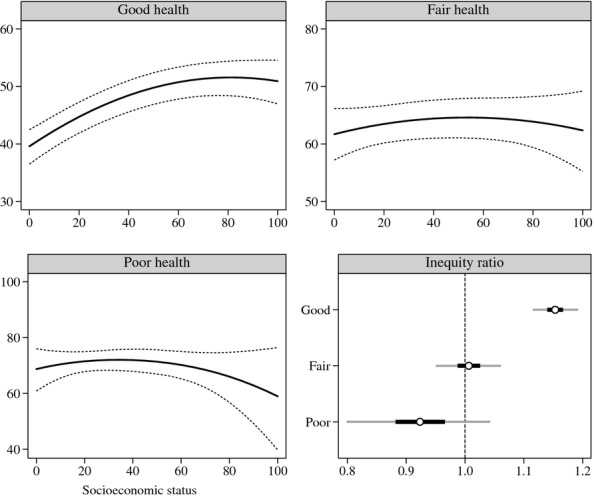
Figure 4.

Stratified Analysis of Basic Medical Tests—For Each Level of Health Status, the Figure Displays (a) the Marginal Median Predicted Probability (percent) of Utilization by SES: Point Estimates (Solid Lines) and 95 percent Confidence Limits (Dashed Lines); and (b) the Inequity Ratio: Point Estimate (White Circle), 50 percent Confidence Limits (Dark Gray Line), and 95 percent Confidence Limits (Light Gray Line)
