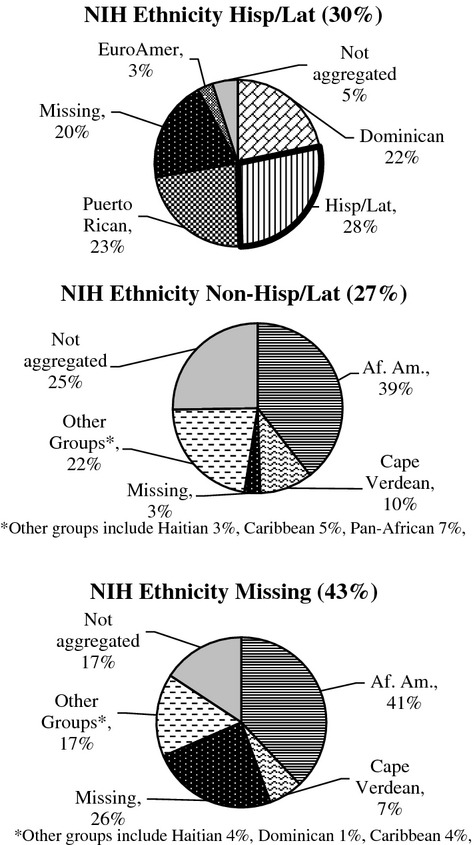
Figure 3.

Aggregated Self-Identified Ethnicity Responses within Each NIH Ethnicity Category
Note. Self-identified ethnicity responses were aggregated into the following categories: “African American” includes those who self-identified as African American (n = 61) and Black/African American (n = 1); “ Hispanic or Latino/a” includes those who self-identified as Catholic Hispanic (1), Hispanic (14), Latin (1), Latin-American (1), and Latino/a (2); “Puerto Rican” includes those who specifically identified as Puerto Rican (n = 17); “Dominican” includes those who self-identified as Dominican (n = 13), Hispanic/ Dominican (n = 1), and American-Dominican (n = 1); “Cape Verdean” includes those who self-identified as Cape Verdean (n = 10), Cape Verdean/Portuguese (n = 2), and American/Cape Verdean (n = 1).“Caribbean” includes Caribbean (n = 2), Jamaican (n = 1), parents Trinidad and Tobago (n = 1) and West Indian (n = 1). “Pan-African” includes those who self-identified as African (n = 6), African/Black (n = 1), Yoruba/African (n = 1); “European American” includes those who self-identified as Caucasian (n = 1), English (n = 1), English/Irish (n = 1), Irish (n = 2), White/Spanish (n = 1), Spanish (n = 1); “Haitian” includes Haitian (n = 5) and African Haitian American (n = 1). “Missing” includes all those who left the item blank (n = 40). “Not aggregated:” Responses not included in aggregate categories include (n = 1 unless otherwise indicated): food, N/A, other, both, Catholic, all of them, none (n = 2), American (n = 3). Responses of Black (n = 7) and White (n = 2) were also not included in an aggregated category as it was unclear to which aggregated category they should be assigned. Mixed ethnicity (n = 5) such as African American/European American or Cape Verdean/Middle Eastern were not included in any category. Pie graph sections outlined in bold represent agreement between NIH ethnicity and self-identified ethnicity.
