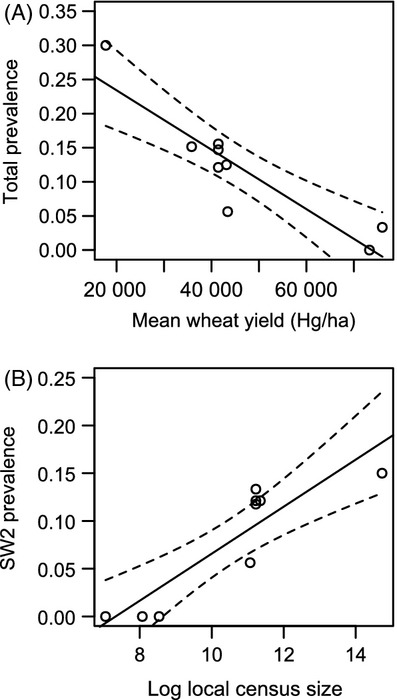
Figure 2.

Haemosporidian prevalence in nine European populations of corncrake plotted against (A) agricultural intensity approximated by the mean wheat yield per country (in Hg/ha) for all haemosporidian lineages pooled and (B) corncrake local census population size for the most widespread lineage only (SW2).
