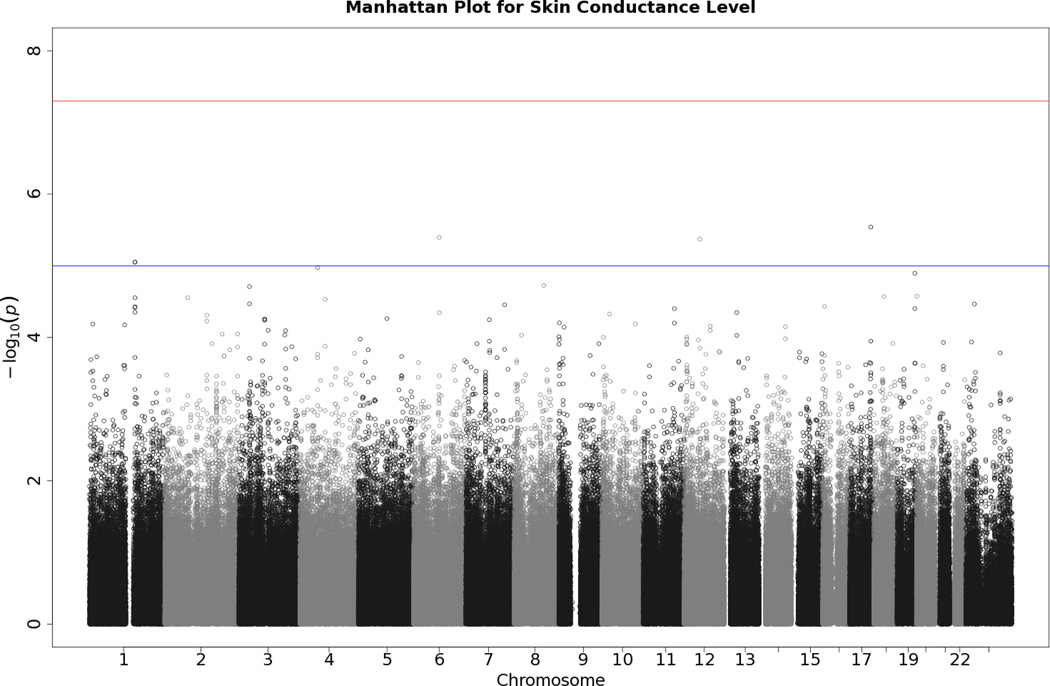
Figure 2.
Manhattan plot of individual SNP associations with SCL. Manhattan plots also depict the distribution of -log10(p values) but are ordered by SNP location on a chromosome, which provides information about the location of any SNPs associated with small p values. The horizontal upper line indicates the genome-wide significance level (5E-08). The horizontal lower line indicates E-05, which is sometimes used to indicate “suggestive” significance.

