FIGURE 3.
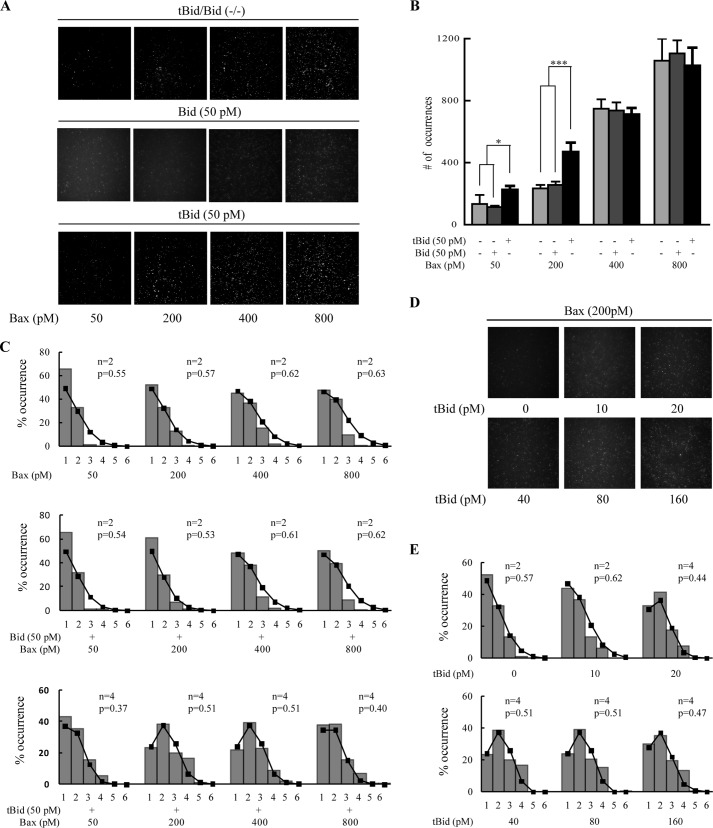
Integration and oligomerization of various concentrations of Bax in the absence and presence of 50 pm tBid or Bid. A, TIRF images at various concentrations of Cy3-labeled Bax (upper panels) and with 50 pm Bid (middle panels) or with 50 pm tBid (lower panels) on lipid bilayers (93% DPPC and 7% cardiolipin). B, numbers of the fluorophore spots at different concentrations of Cy3-labeled Bax and with 50 pm Bid or tBid. Error bars show the S.D. of five independent experiments. *, p < 0.05 and ***, p < 0.001 between the data in the absence and the presence of tBid. C, distributions of photobleaching steps of the fluorophore spots on lipid bilayers (93% DPPC and 7% cardiolipin) incubated with different concentrations of Cy3-labeled Bax and with 50 pm Bid or tBid. D, TIRF images of 200 pm Cy3-labeled Bax with various concentrations of tBid on lipid bilayers (93% DPPC and 7% cardiolipin). E, distributions of photobleaching steps of the fluorophore spots on lipid bilayers (93% DPPC and 7% cardiolipin) incubated with 200 pm Cy3-labeled Bax with various concentrations of tBid.

