FIGURE 2.
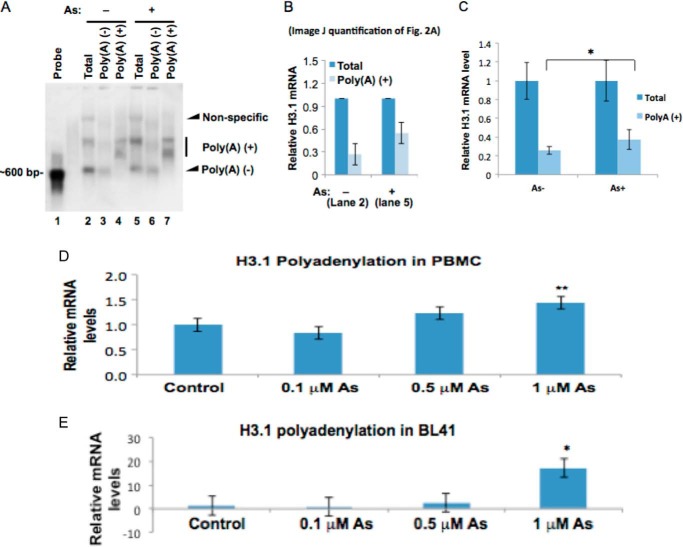
Polyadenylated H3.1 mRNA is doubled by arsenic treatment. A, Northern blot. Total RNA was prepared from BEAS-2B cells treated or untreated with 1 μm arsenic for 48 h. 75 μg was used to purify poly(A)+ mRNA using poly(dT) beads, and all purified polyadenylated mRNA was separated on the agarose gel (lanes 4 and 7). The unbound flow-through fraction was designated as poly(A)−. 10 μg of total mRNA and poly(A)+ fractions were also separated on the gel. Northern blot was carried out using H3.1 cDNA as the probe. The poly(A)− fractions in treated cells are decreased by arsenic exposure, whereas poly(A)+ fractions are increased (compare lanes 2 and 5). B, ImageJ quantification of the bands in lanes 2 and 5 of Fig. 2A. The bar graph shows relative quantification of polyadenylated H3.1 mRNA. The band intensities from lanes 2 and 5 in A were quantified using ImageJ software. The sum of poly(A)+ and poly(A)− in each lane was designated as “total” and set to 1, respectively. The percentage of the poly(A)+ fraction was calculated by dividing the intensity of the poly(A)+ band by each total. C, total mRNA and poly(A)+ mRNA were purified by using random and poly(dT) primers in a reverse transcription reaction, respectively. The levels of total H3.1 mRNA and poly(A)+ H3.1 mRNA were measured by qPCR and normalized by GAPDH. The total mRNA before and after the treatment was set to 1, respectively. D and E, total RNA was extracted from each cell line after a 48-h treatment with 0, 01, 0.5, or 1 μm NaAsO2. mRNA was then converted to cDNA using oligo(dT) primers. H3.1 polyadenylation was then measured by quantitative RT-PCR. Polyadenylation levels of H3.1 in PBMCs (D) and BL41 cells (E) are shown. The relative gene expression level was normalized to 18 S rRNA expression and is presented as -fold change to the level expressed in each cell line. Error bars represent S.D.

