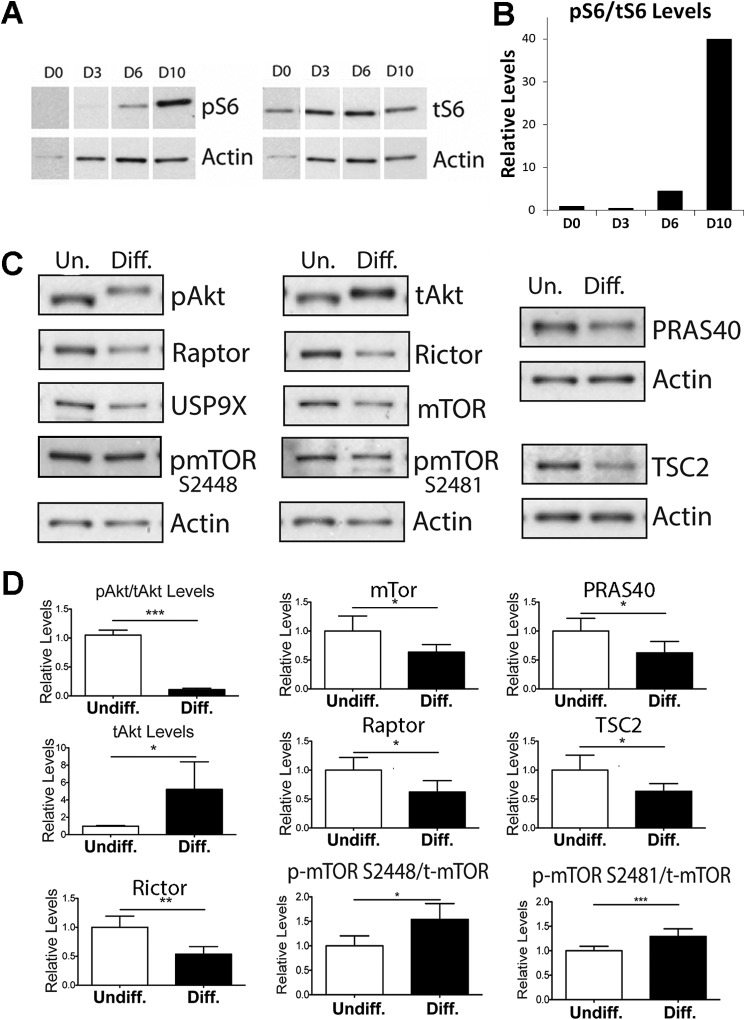
FIGURE 3.
mTORC1 kinase activity and levels of mTOR interacting proteins change upon mESCs differentiation. A, a time course of mTORC1 activity during differentiation was analyzed by measuring S6 phosphorylation. B, the ratios of phospho-S6 (pS6) to total S6 (tS6) protein levels at these time points is shown. C, representative Western blots of mTOR and specific interacting protein levels in undifferentiated and differentiated R1 mESCs. Protein samples collected for undifferentiated and differentiated R1 mESCs were also analyzed for phospho-mTOR (pmTOR) Ser-2448 and Ser-2481 and total mTOR (tmTOR) levels. Actin was used as a loading control for all of the gels. The phospho-mTOR level was further normalized to total mTOR. D, quantitation of at least three biological replicates of experiments shown in C (*, p < 0.05; **, p < 0.005; ***, p < 0.0005). Error bars, S.E.

