
FIGURE 5.
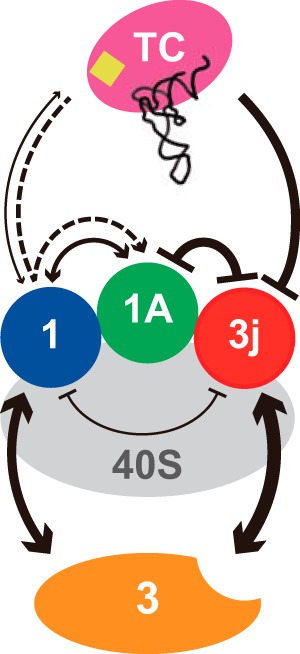
Cooperativity among factors within the 43 S PIC. Positive and negative cooperativity are indicated as arrows and bar-headed lines, respectively. Dashed arrows indicate indirect stabilization mediated by eIF1. The thickness of the lines represents relative strength of the effect.